Article by IG Senior Market Analyst Axel Rudolph
FTSE 100, DAX 40, S&P 500 ANALYSIS AND CHARTS
FTSE 100 drops on disappointing UK growth
The FTSE 100 is about to end its four straight day winning streak as much weaker-than-expected UK GDP pushes the index lower. UK GDP dropped by 0.5% month-on-month in July, the quickest pace in seven months, versus an expected 0.2% decline. Year-on-year GDP dropped to 0% versus a forecast 0.4%.
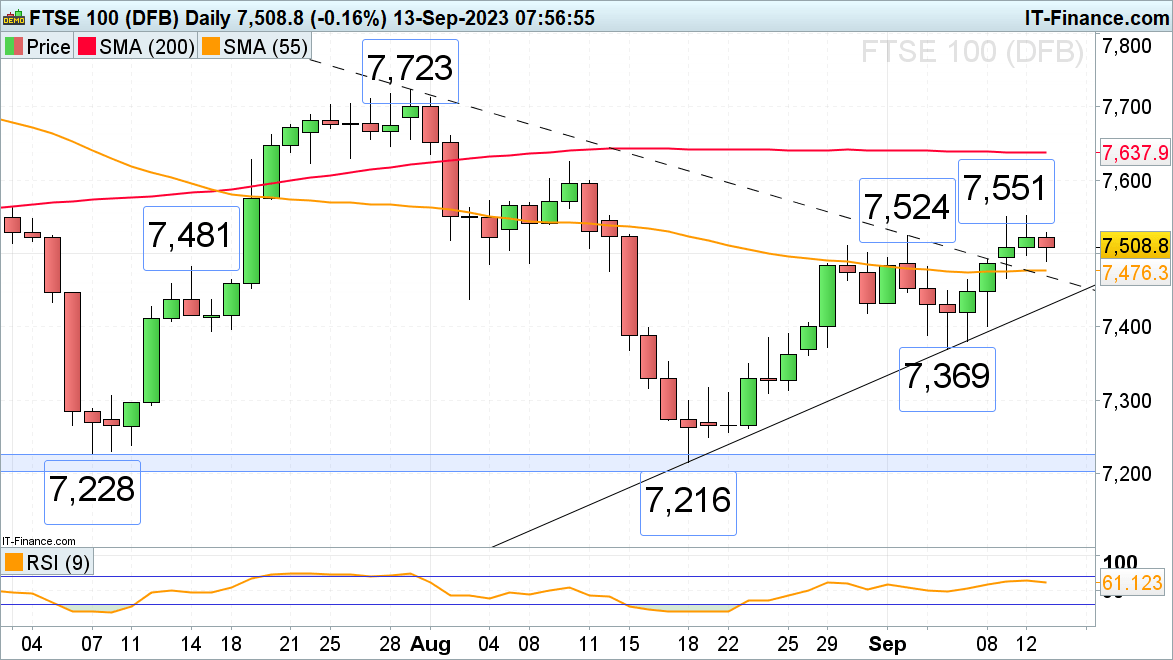
The UK blue chip index is seen slipping back towards the 55-day simple moving average (SMA) at 7,476. Below it, the breached July-to-September downtrend line at 7,468, because of inverse polarity, might also act as support. While this and last week’s highs at 7,524 to 7,551 cap, the index is expected to range trade with a slight downward bias.
Only a rise and daily chart close above Tuesday’s high at 7,551 could open the way for the 200-day simple moving average (SMA) at 7,638.
DAX 40 on track for second day of losses
The DAX 40 is heading back down again as European Central Bank (ECB) sources suggested last night that inflation forecasts would remain above 3% in 2024, strengthening the view that an interest rate hike will follow at the meeting on Thursday. Last week’s low at 15,575 is thus back in focus. As long as it holds on a daily chart closing basis, Monday’s low at 15,723 may be revisited. The next higher July-to-September downtrend line at 15,850 and the 24 August high at 15,895 are unlikely to be revisited on Wednesday, though.
Were last week’s low at 15,575 to be slid through on a daily chart closing basis, the 200-day simple moving average (SMA) and August low at 15,528 to 15,469 would be in focus.


